


 47 / 100

August
2019
HYDROCARBON
ENGINEERING
45
datasheet. The reboiler duty is estimated as 42.8 MW
using the heat duty equation (considering clean tubes).
This is around 46% higher than the estimated reboiler
duty during the FEED and leads to a significant
increase in the relief load. The detailed calculation is
presented in Table 4.
The relief load using the ‘clean’ reboiler duty of
42.8 MW (154 080 000 kJ/hr), which was based on the
thermal design of the reboiler, is evaluated in Table 5.
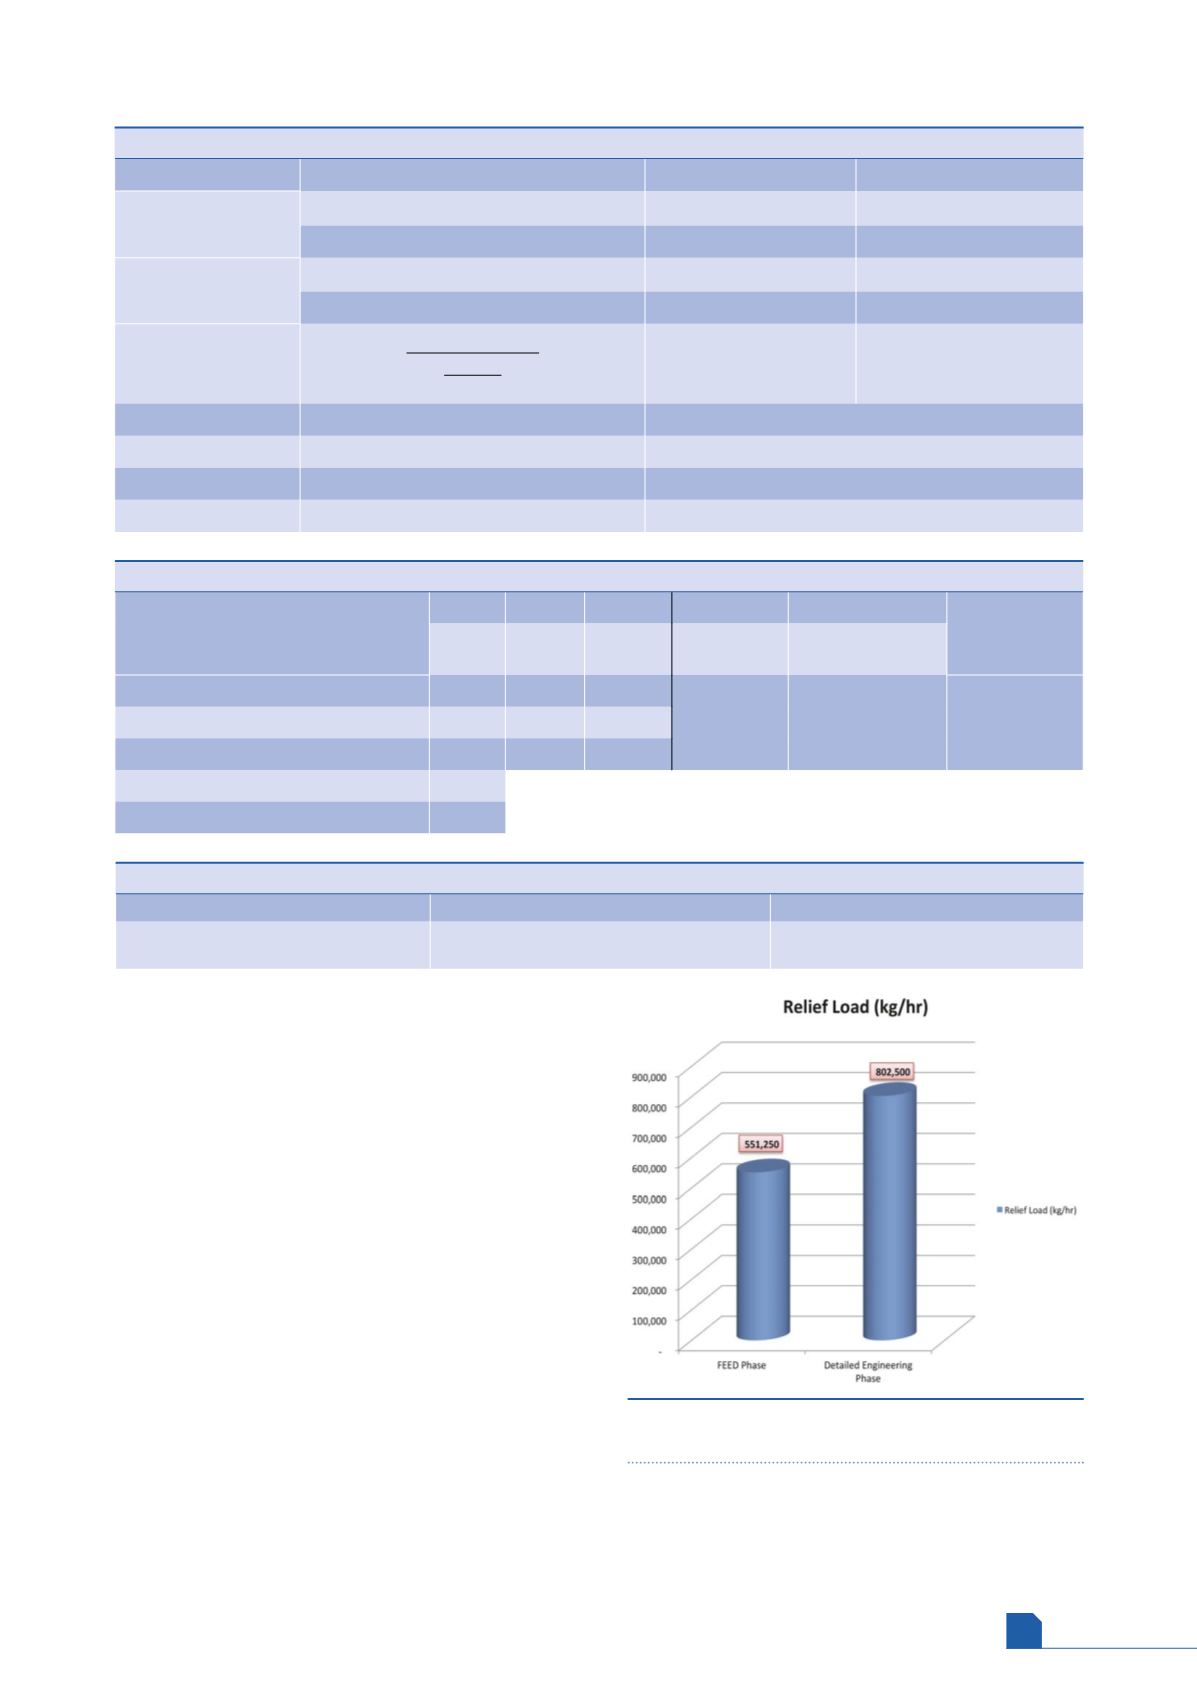
As can be seen from Tables 2 and 5, the relief load
increased significantly, from 551 250 kg/hr to
802 500 kg/hr as the project advanced from the FEED
phase to the detailed engineering phase (depicted in
Figure 2), resulting in the requirement of one additional
PSV (Table 6) and additional piping which led to an
increase in cost from that estimated during the FEED
phase.
To illustrate how a relief load can be underestimated if
full details of the system are unknown during the FEED
stage of the project, a similar calculation (i.e. total power
failure scenario) has been performed that considers an
induced draft air-cooled condenser without automatic
louvre control. In this case, condenser duty has been taken
as 25% of normal duty (i.e. 7.2 MW) to account for natural
convection. The calculated relief load works out as
approximately 83% of the required load (Table 7).
Figure 2.
Increase in relief load from FEED to the
detailed engineering phase of a project.
Table 5.
Total power failure relief load estimate during detailed engineering phase
+
-
-
+
-
Q
u
(unbalanced
heat [kJ/hr])
Feed Bottoms Overhead Q
b
(reboiler
duty [kJ/hr])
Q
c
(condenser duty
[kJ/hr])
Mass flow (kg/hr)
0
0
0
154 080 000
0
154 080 000
Specific enthalpy (kJ/kg)
-2478 -1636
-1443
Total enthalpy (kJ/hr)
0
0
0
Latent heat of accumulation stream (kJ/kg)
192
Relief rate (kg/hr)
802 500
Table 6.
Relief valve configuration adopted
FEED phase
Detailed engineering phase
No. and size of PSVs required
8T10 (one operating and one spare)
6R8 (one operating)
8T10 (two operating and one spare)
Table 4.
Estimation of reboiler duty with clean tubes
Unit
Normal condition
Relieving condition
Cold side
Inlet temperature, t1 (˚C)
112.7
150.4
Outlet temperature, t2 (˚C)
114.3
150.4
Hot side
Inlet temperature, T1 (˚C)
145
165
Outlet temperature, T2 (˚C)
143.5
163
LMTD
(
T
1 –
t
2) – (
T
2 –
t
1)
(
T
1 –
t
2)
(
T
2 –
t
1)
ln
30.75
14.1
Clean exchanger
Overall heat transfer coefficient, U
c
(W/m
2
˚C)
3492
Fouled exchanger
Overall heat transfer coefficient, U
n
(W/m
2
˚C)
971
Clean exchanger
Heat duty, Q
c
(MW)
42.8
Fouled exchanger
Heat duty, Q
n
(MW)
23.5
(˚C)