


 46 / 100

August
2019
HYDROCARBON
ENGINEERING
44
When performing the mass and enthalpy balance,
mass flow and enthalpy are added algebraically (a positive
sign is used for mass or enthalpy into the relief envelope
and a negative sign is used for mass or enthalpy out from
the relief envelope). The normal mass and enthalpy flows
at the operating conditions are shown in Table 1.
The enthalpy difference during normal operation
(i.e. enthalpy in minus enthalpy out) is in the range of
0.01% of the total enthalpy in and can be neglected.
Total power failure scenarios for the depropaniser
during the FEED and detailed engineering phase of a
project using the UHM are analysed below and the results
compared.
Total power failure case analysis during FEED phase
During total power failure all the electrical motors would
cease and this results in the following consequences:
Feed to the depropaniser stops.
Overhead and bottoms pumps stop.
Condenser duty is set to zero as louvre control is
being used (louvres are assumed closed).
The LP steam-heated reboiler continues to operate.
Based on preliminary calculations during the FEED
stage of the project, the reboiler duty was estimated as
29.4 MW (105 840 000 kJ/hr) (assuming reboiler tubes are
clean). The relief rate has been estimated in Table 2.
The physical properties of the relief stream are
presented in Table 3 (based on the data for the tower’s
reflux, i.e. the ‘accumulation’ stream at its dew point).
Total power failure case analysis during detailed
engineering phase
In this scenario:
The feed to the depropaniser stops.
The overhead and bottom pumps stop.
The condenser duty is set to zero.
The reboiler will continue to operate using LP steam.
However, as the thermal design of the reboiler is
available in the detailed engineering phase of the
project, the effect of clean reboiler tubes can be
accurately determined from the heat transfer
coefficients picked up from the reboiler thermal
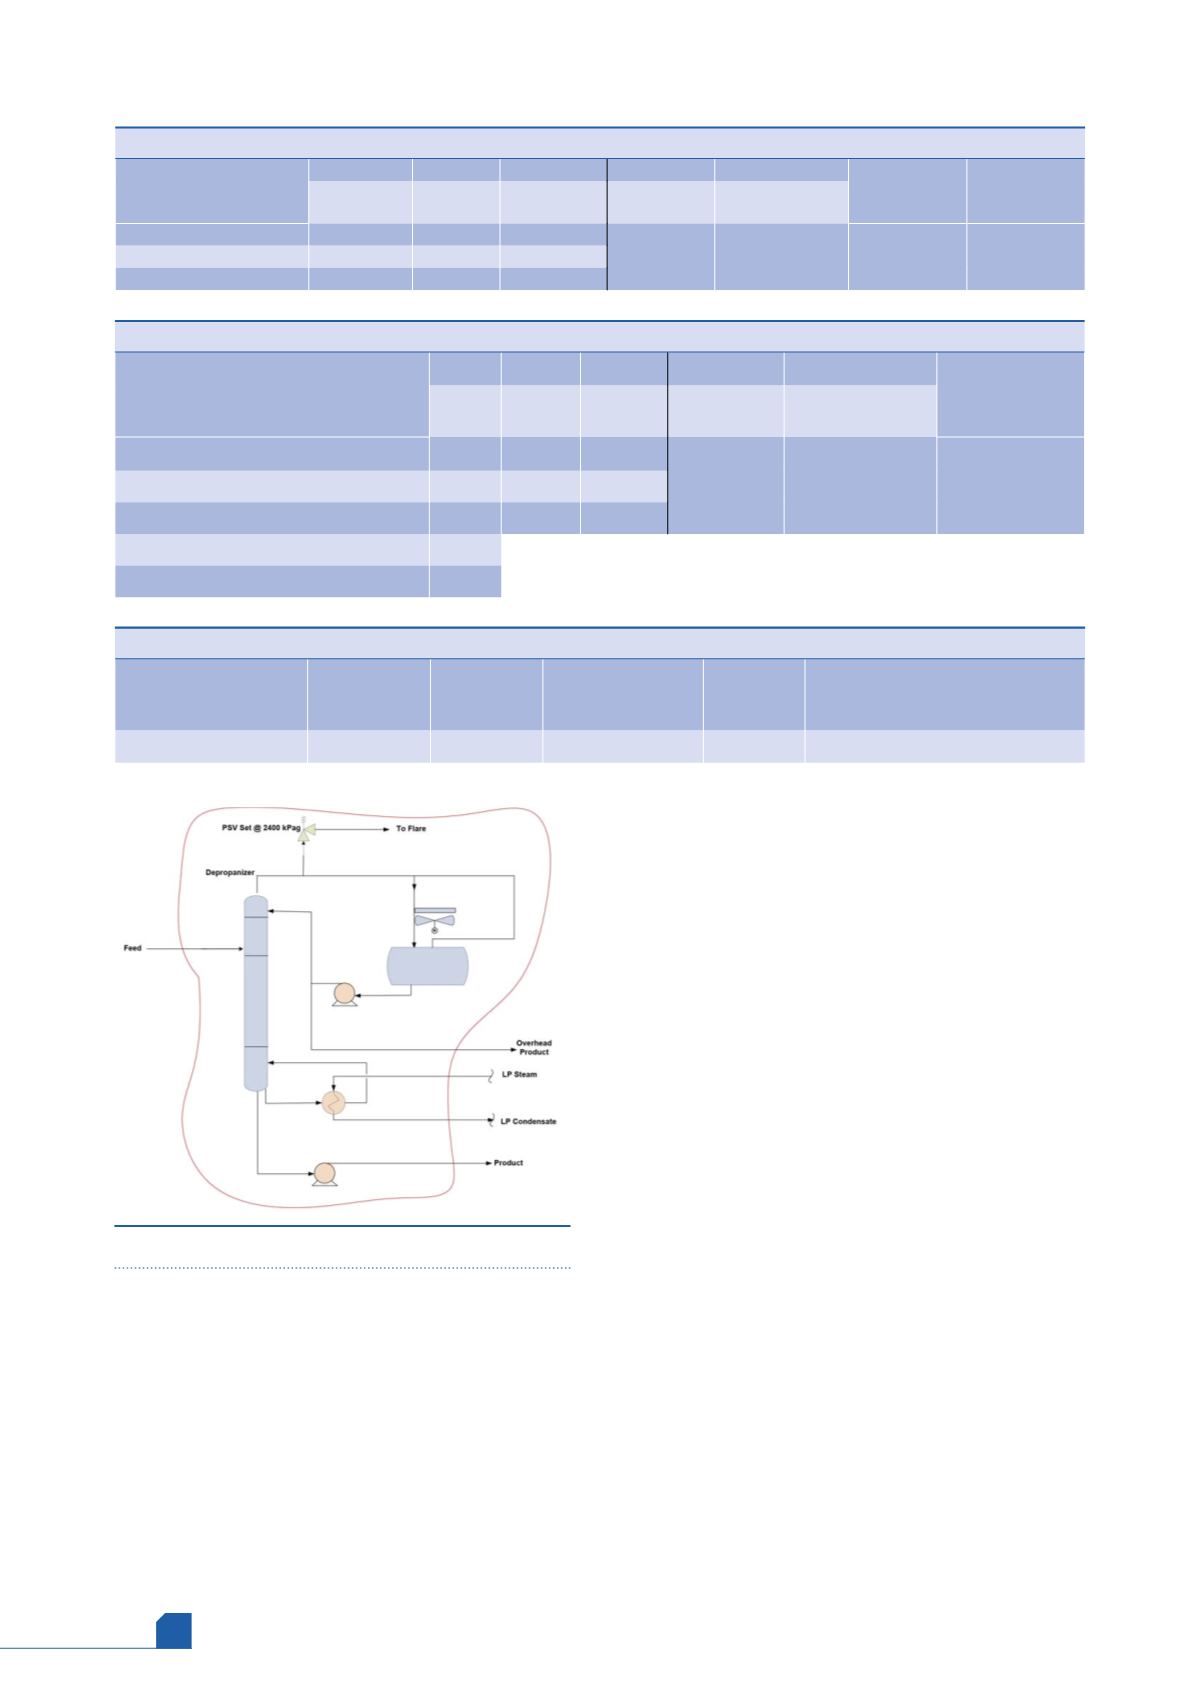
Figure 1.
Relief envelope: depropaniser.
Table 1.
Depropaniser operating conditions
+
-
-
+
-
Enthalpy in -
enthalpy out
(kJ/hr)
Mass in - mass
out (kg/hr)
Feed
Bottoms Overhead Q
b
(reboiler
duty [kJ/hr])
Q
c
(condenser
duty [kJ/hr])
Mass flow (kg/hr)
200 800
2446
198 354
84 600 000
103 716 000
-27708
0
Specific enthalpy (kJ/kg)
-2478
-1686
-2584
Total enthalpy (kJ/hr)
-497 582 400 -4 123 956 -512 546 736
Table 2.
Total power failure relief load estimate during FEED phase
+
-
-
+
-
Q
u
(unbalanced
heat [kJ/hr])
Feed Bottoms Overhead Q
b
(reboiler
duty [kJ/hr])
Q
c
(condenser duty
[kJ/hr])
Mass flow (kg/hr)
0
0
0
105 840 000
0
105 840 000
Specific enthalpy (kJ/kg)
-2478 -1636
-1443
Total enthalpy (kJ/hr)
0
0
0
Latent heat of accumulation stream (kJ/kg)
192
Relief rate (kg/hr)
551 250
Table 3.
Physical properties for case study 1
Relief temperature (˚C)
MW
Ideal specific
heat ratio
(Cp/Cv)
Compressibility
factor (Z)
Viscosity
(cP)
Latent heat of vaporisation (kJ/kg)
75.6
43.6
1.06
0.7
0.01
192