


 52 / 100

August
2019
HYDROCARBON
ENGINEERING
50
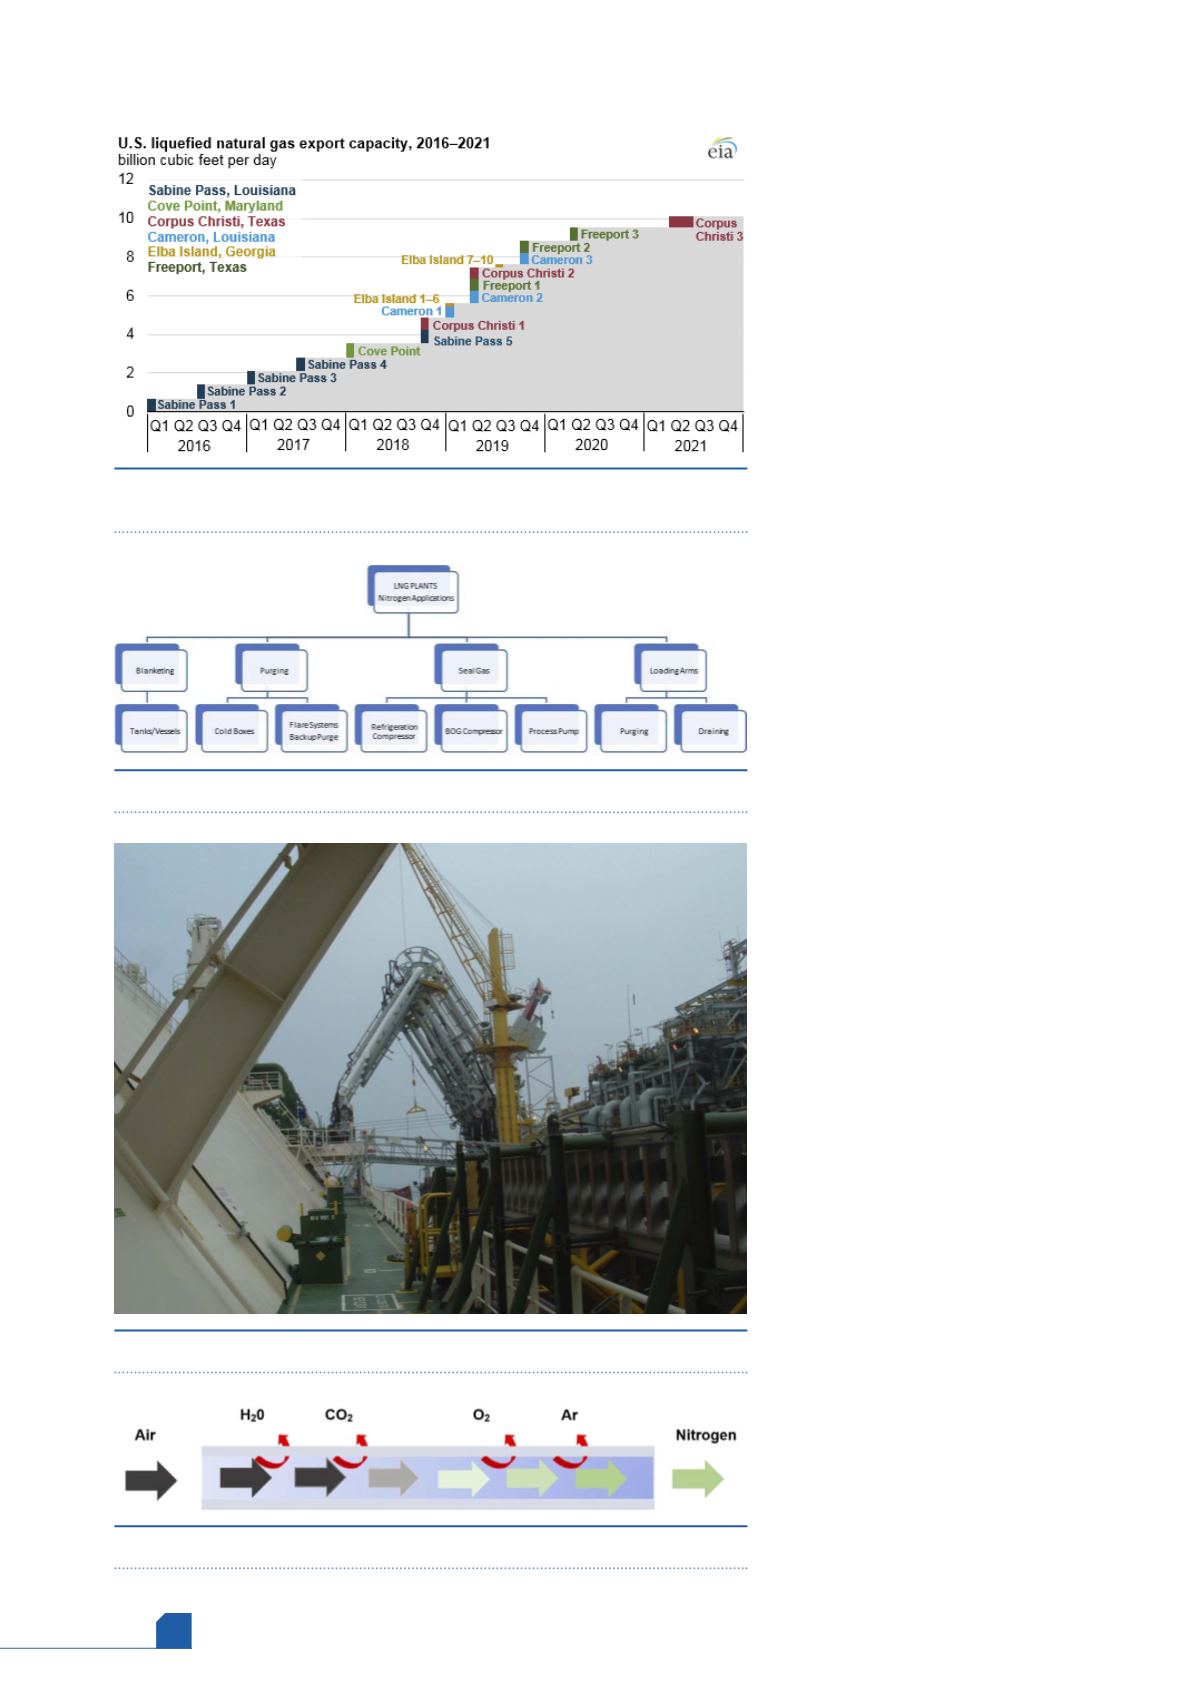
in February 2016 when Cheniere
Energy’s Sabine Pass liquefaction
terminal shipped its first cargo. The
EIA projects that US LNG export
capacity will reach 8.9 billion ft
3
/d
by the end of 2019, making it the
third largest LNG exporter in the
world behind Australia and Qatar
(Figure 1).
1
LNG plants
The LNG process chain consists of
exploration, production,
liquefaction, shipping, storage and
regasification. Natural gas primarily
consists of methane. In its liquid
form, methane reduces its volume
by 600 times. The typical LNG plant
process can be visualised as a big
refrigeration cycle in which the inlet
feed stream of natural gas is
liquefied for ease of storage and
shipping.
This incoming natural gas must
be cleaned and filtered from
components that would otherwise
freeze, plug equipment or
contaminate downstream processes.
The gas is then liquefied in stages to
approximately -260˚F using various
refrigeration cycles and then stored
onsite in massive LNG storage tanks.
Role of nitrogen in LNG
plants
A typical nitrogen plant set up
within the LNG plant would consist
of air compressors, air dryers,
instrument air receiver, N
2
generator,
N
2
receiver, N
2
distribution header
and finally N
2
users. Concurrently,
some LNG plants also have liquid
nitrogen storage and vaporisation
systems serving as a backup or to
supplement the existing demand as
required.
In an LNG plant, nitrogen is used
for all purging and inerting required
within the facility, from the
blanketing of tanks, and purging of
cold boxes, to seal gas for various
compressors, and ultimately the
purging and draining of loading arms.
Nitrogen is classified as a critical
system in the plant and is always
required. Typically, most of these
plants require a minimum purity of
96% to a high of 98.5%. For a given
range and purity, onsite generation
of nitrogen from membrane
Figure 1.
LNG export capacity chart (source: US Energy Information
Administration [EIA]).
1
Figure 4.
Separation by permeation.
Figure 2.
Nitrogen applications in LNG plants.
Figure 3.
LNG loading arms (source: Adriatic LNG).