


 20 / 100

August
2019
HYDROCARBON
ENGINEERING
18
Table 1 presents a summary of Australia’s LNG projects, as
reported by the Department of Industry, Innovation, and
Science.
According to the Australian Department of the
Environment and Energy, national LNG exports in financial
year (FY) 2017 – 2018 totalled nearly 61.691 million t valued at
over AUS$30.9 billion. Japan was the largest customer,
importing 27.422 million t, followed by China, which
purchased 19.644 million t, and South Korea, which imported
6.028 million t. The Department noted that new customers
have emerged, including small markets of New Caledonia and
Timor-Leste.
Australia’s LNG exports have soared, and they are reaching
a larger number of customers. Figure 3 shows the growth and
diversification of exports from 1997 through 2018. Japan is the
single-largest customer, but exports to other Asian customers
have grown significantly. In the early years, Japan took
essentially all (more than 95%) of Australia’s output, with
occasional cargoes going to the US or Europe (Spain and the
UK.) South Korea received its first cargo in 2000, and exports to
South Korea rose to 10.8 billion m
3
in 2018. Taiwan and India
both started purchasing Australian LNG in 2005. Taiwan
imported 3.5 billion m
3
in 2018, while India imported
2 billion m
3
. China received its first cargo of Australian LNG in
2006, and China has emerged as a major consumer. Exports to
China jumped from a modest 1 billion m
3
in 2006 to
32.1 billion m
3
in 2018 – nearly as much as Japan imported.
Australian oil product demand
Australia’s domestic sales of petroleum products have grown
at a robust rate of 2.2% per year on average between
FY 2010 – 2011 and 2017 – 2018. Demand grew from
893 600 bpd in 2010 – 2011 to over 1.041 million bpd in
2017 – 2018. Diesel and jet fuel have posted the most rapid
growth. The demand barrel is high in value, with the
percentage share of fuel oil and other products falling from
6.1% in 2007 – 2008 to 3.3% in 2014 – 2015. Fuel oil demand fell
from 27 000 bpd in 2007 – 2008 to 12 400 bpd in 2012 – 2013,
but it crept back up to 16 900 bpd in 2016 – 2017. This may in
part be explained by the declining price of oil, the
introduction of Australia’s carbon tax in 2012, and its repeal in
2014, as discussed.
Australia’s gasoline demand fell from 331 500 bpd in
2007 – 2008 to 312 100 bpd in 2014 – 2015. It crept back up
to 316 500 bpd in 2017 – 2018. The market is growing
more oriented toward diesel, demand for which grew
from 314 800 bpd in 2007 – 2008 to 486 800 bpd in
2017 – 2018. Gasoline’s share of the demand barrel fell
from 37.8% in 2007 – 2008 to 30.4% in 2017 – 2018,
while diesel’s share has risen from 35.9% in 2007 – 2008
to 46.8% in 2017 – 2018. Jet fuel demand also has grown
quickly, with demand rising from 108 600 bpd in
2007 – 2008 to 161 600 bpd in 2017 – 2018.
Ethanol blended gasolines of up to 10% ethanol by
volume began to be phased in beginning in 2006. The
State of New South Wales was the first to institute a
blending mandate, and Queensland followed. The
mandates are limited in scope and area, and biofuels
have had to compete with inexpensive oil over the past
few years. Sales of ethanol blended gasoline jumped to
57 900 bpd in FY 2010 – 2011, but sales languished, and they
averaged just 40 300 bpd in 2014 – 2015. An uptick in
demand to 44 500 bpd came in FY 2017 – 2018 as additional
ethanol blended gasoline was required in Queensland. A
steady upward trend would require additional blending
mandates and/or more favourable economics.
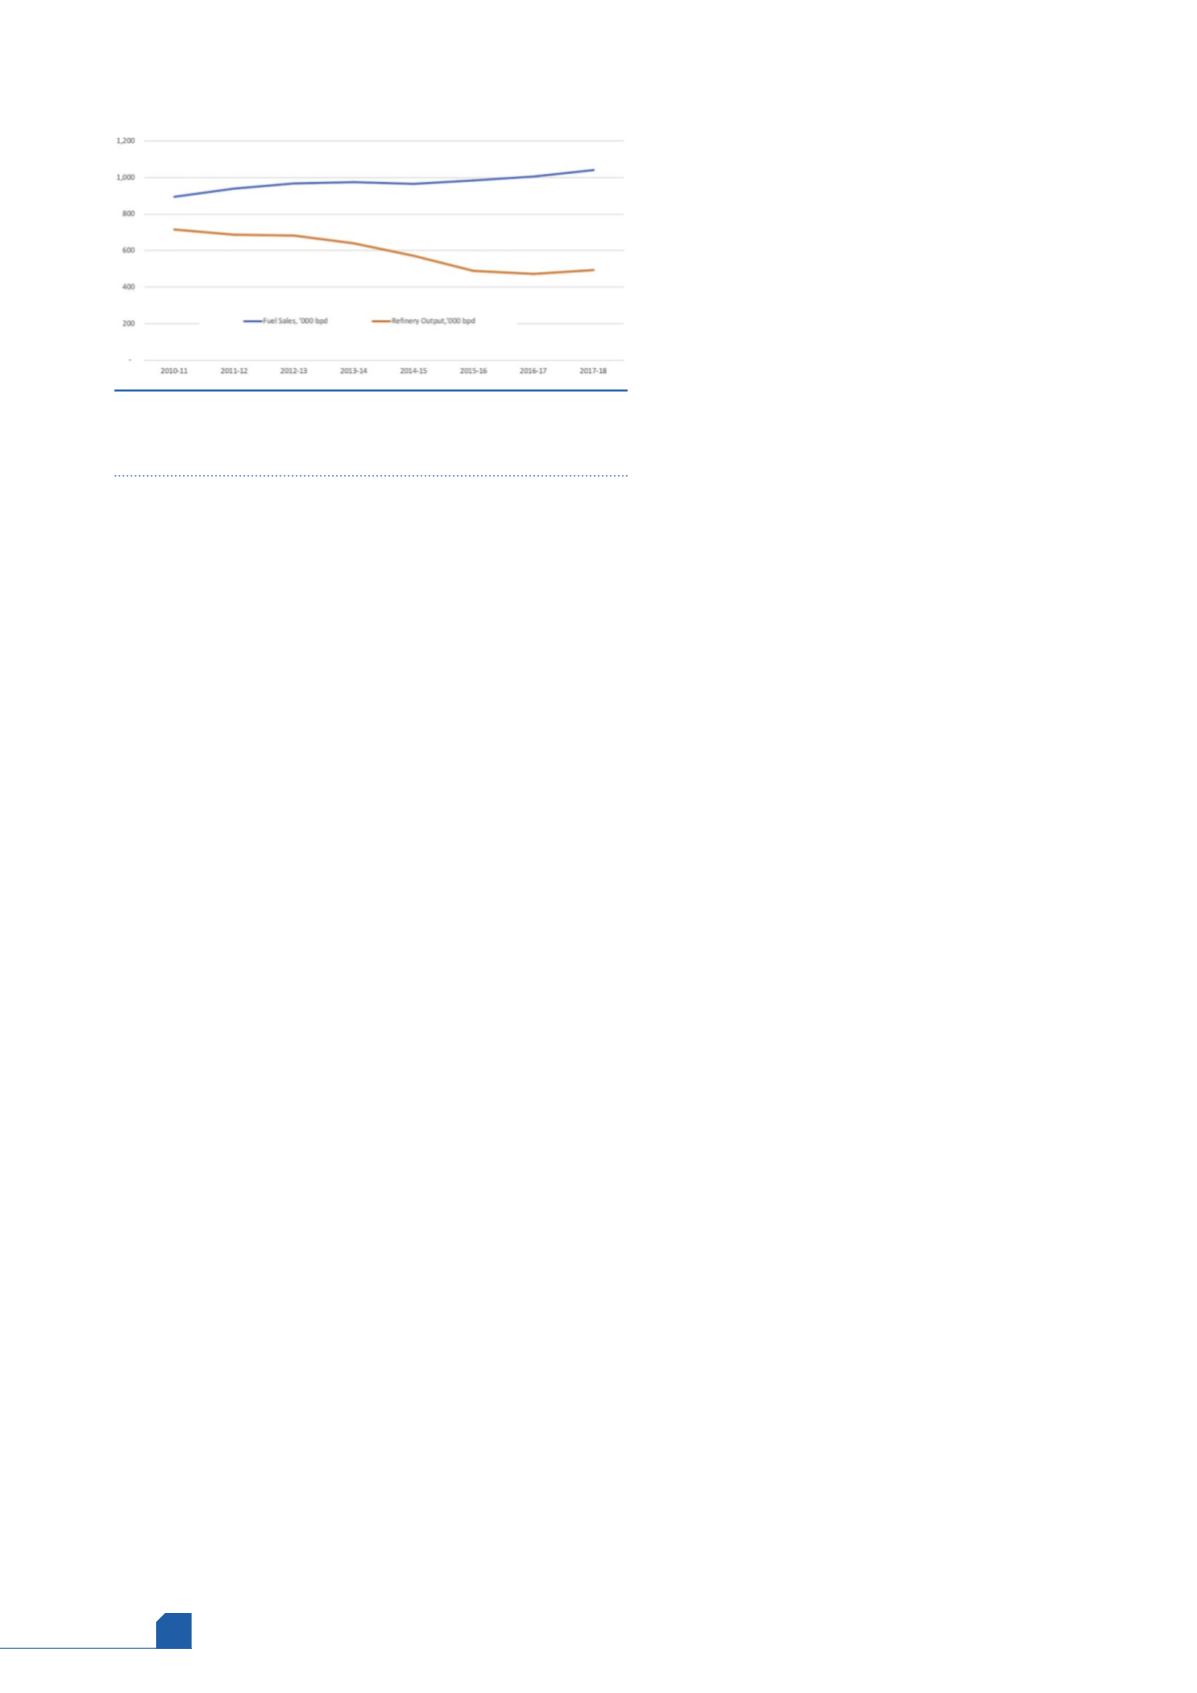
Australian fuel demand has grown, yet refinery output
has fallen. Figure 4 compares the trend in demand with
refinery production. In 2010 – 2011, fuel sales exceeded
refinery output by 178 000 bpd. In FY 2017 – 2018, the supply
gap had tripled, with fuel sales exceeding refinery
production by 547 000 bpd. The following section discusses
the contraction of Australia’s refining sector.
Australian refining: plans for
expansion turn to contraction
The 1980s and 1990s were known as the time of the Asian
demand boom. By the mid- to late-1980s, oil prices had
collapsed, and demand began to grow in some Asian
countries at double-digit rates. Essentially every country in
the region expanded its refining industry during that time.
Australian refinery capacity expanded also. For a time,
Australian refining companies and potential new entrants
explored the idea of building export-oriented refineries
targeted at the growing Asia-Pacific market. These ideas
included proposals to build sophisticated grassroots
refineries in the Northern Territory and Western Australia.
These states possessed oil and gas reserves that hitherto
had been less attractive because of their distance from
larger population centres. The Asian Boom provided more
incentive to develop Western Australian basins, which were
also essential to replace supplies from mature and declining
oilfields in Victoria and South Australia.
But these were not low-cost developments, and
Australia remained a net importer of refinery feedstock.
Building export refineries would therefore have relied upon
imported feedstock, likely shipped in from the Middle East,
and product then would be shipped into Asia, where it
would have had to compete with other exporters, including
Singapore. The economics were not compelling, and
Australian export refinery proposals were postponed and
ultimately cancelled.
Australia’s downstream companies then began to
contemplate the outlook for growth in their existing
Figure 4.
Australia’s refinery output falling below demand
product sales (‘000 bpd). Source: Department of Environment
and Energy.