


 22 / 100

August
2019
HYDROCARBON
ENGINEERING
20
market area. Some of them decided to close their refineries
entirely. Thus, not only did Australia fail to become a major
export refining hub in the region, the refining industry
began to shrink. The domestic market was limited, and
gasoline demand was forecast to decline. Domestic crude
oil production was declining as well, pointing to a future of
imported crude feedstocks. The Department of
Environment and Energy reported that the percentage of
indigenous refinery inputs fell to 20.3% in 2017 – 2018.
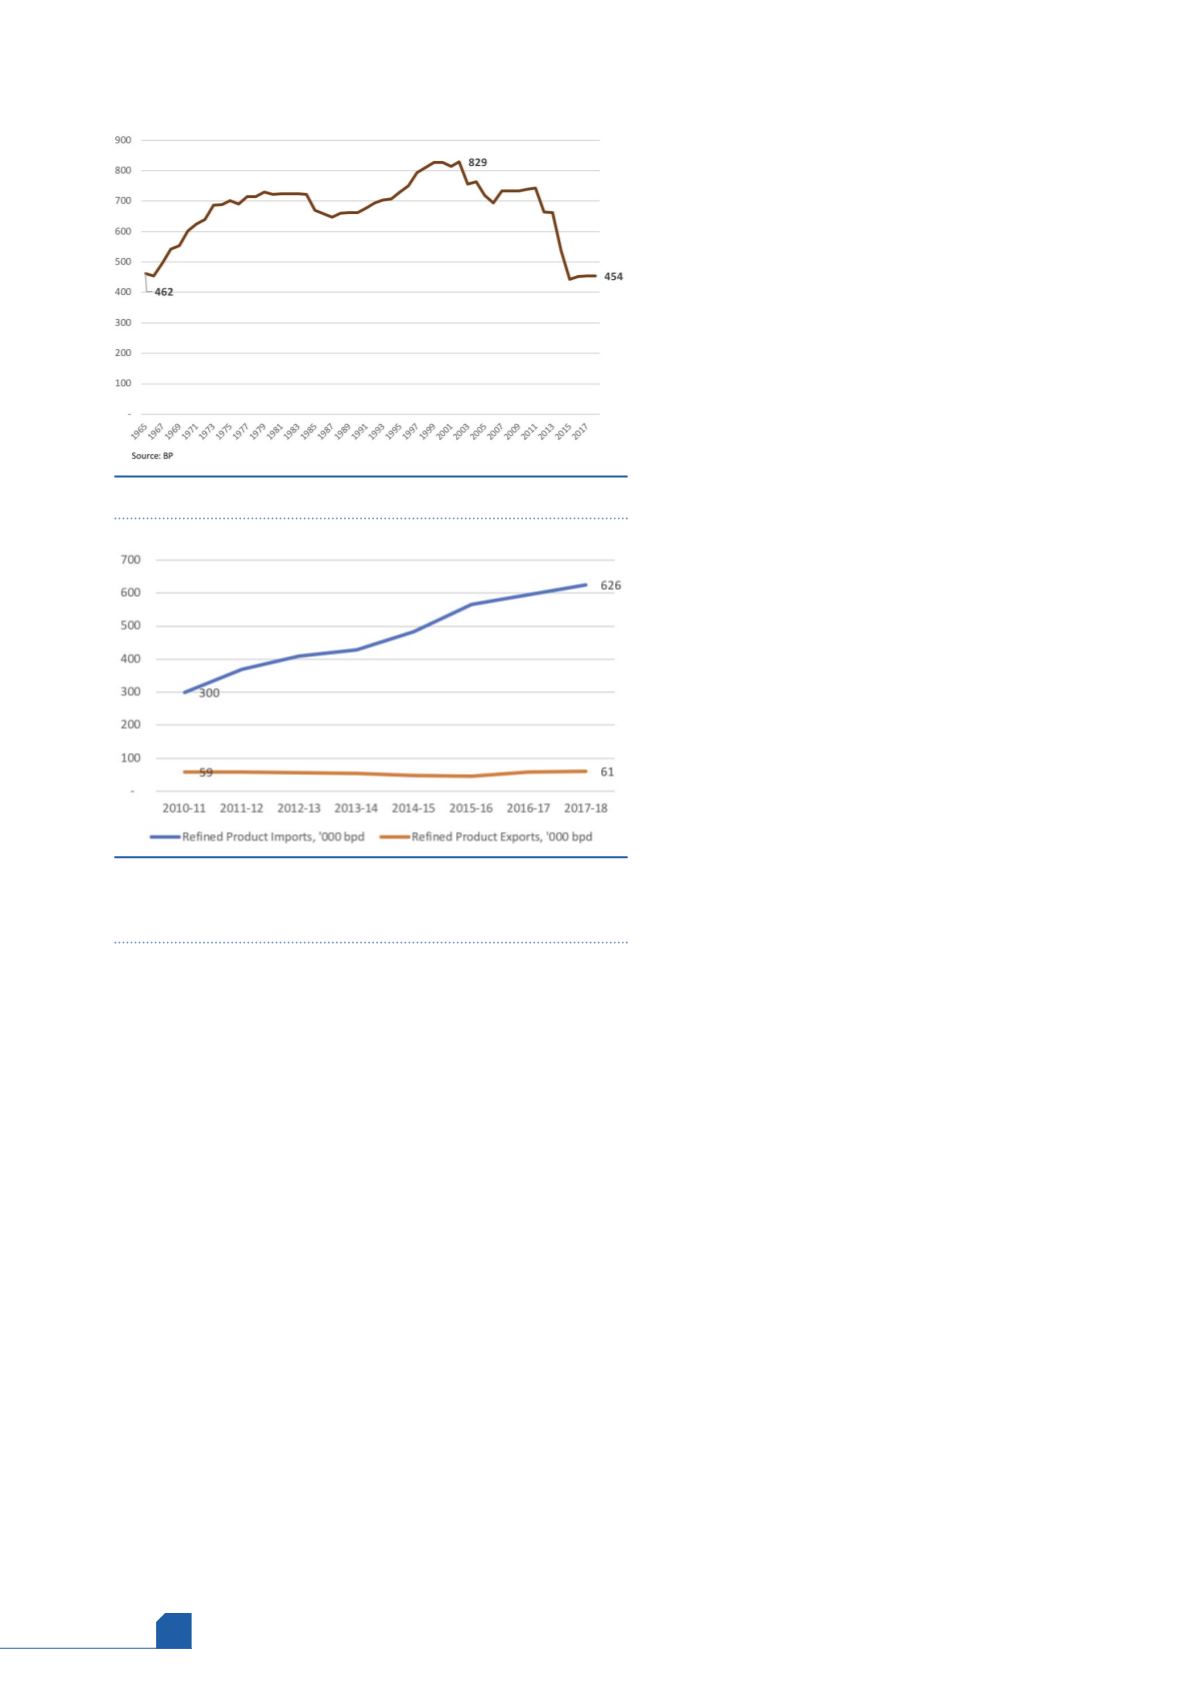
Figure 5 traces how Australia’s crude refining capacity
peaked at 829 000 bpd in 2002, dropped below
700 000 bpd in 2006, and collapsed to 452 000 bpd in 2016
before creeping back slightly to 454 000 bpd in 2018.
Caltex closed its Kurnell refinery at the end of 2014. BP
closed its Bulwer Island refinery in 2015. Shell already had
begun to divest itself of refinery assets in many parts of
the globe, and this included Australia. Shell announced
that it would convert its Clyde refinery to a product
terminal in 2013, and Shell sold its Geelong refinery to the
oil trading company Vitol in 2014. This refinery is now
known as the Viva Vitol refinery.
Today, only four refineries remain in operation: BP
Kwinana, Caltex Lytton, ExxonMobil Altona, and Vitol Viva
Geelong. These refineries share a number of similarities.
They are mid-sized, they rely on catalytic cracking as their
central upgrading technology, and they use a
combination of catalytic reforming, alkylation, and
isomerisation for octane provision. The refineries are
oriented toward gasoline. Australian refinery output in
FY 2017 – 2018 was 39.8% gasoline, 32% diesel, 13.3% jet
fuel, 2.7% fuel oil, 3.4% LPG, and 8.7% other products.
Australia now depends on imports for most of its
needs. Diesel sales in FY 2017 – 2018, for example,
were 486 800 bpd. Refinery production was only
158 300 bpd, less than 33% of demand. Domestic
refineries satisfied 62% of the gasoline market.
Gasoline production in 2017 – 2018 was 197 000 bpd,
against sales of 316 500 bpd.
Refined product exports dwindle,
imports grow
Australia’s refined product exports have fallen, while
imports have risen. As Figure 6 illustrates, refined
product imports have more than doubled from
300 000 bpd in 2010 – 2011 to 626 000 bpd in
2017 – 2018. Looking back further in history, in
2001 – 2002, Australia imported only around
74 000 bpd of refined products. The wave of refinery
closures brought a steady increase in imports.
Middle distillate imports have grown swiftly. In
FY 2001 – 2002, middle distillate imports were only
26 000 bpd. In FY 2007 – 2008, this jumped to
160 700 bpd. By 2017 – 2018, diesel imports had
expanded to 346 800 bpd. In total, Australia’s imports
of refined product increased at rates averaging 11.1%
per year between 2010 – 2011 and 2017 – 2018. This has
amounted to an increase of nearly 325 500 bpd of
refined products in just seven years.
Product exports have fallen and stagnated in
recent years. In 2001 – 2002, product exports were
114 000 bpd. This fell to 58 600 bpd in 2010 – 2011, and
product exports averaged 60 900 bpd in 2017 – 2018.
Exports exclude international bunkering, which were
reported at 38 600 bpd in 2017 – 2018. Most of this
(33 650 bpd) was aviation fuels.
Most of Australia’s product exports are LPG. In
FY 2017 – 2018, LPG accounted for 65% of the 60 900 bpd
exported. Most of this is shipped to Asia-Pacific
destinations such as Japan, South Korea, Indonesia, and
Singapore, but cargoes travel as far as Africa.
Gasoline and diesel exports are now quite small: in
FY 2017 – 2018, gasoline exports were 2600 bpd, and diesel
exports were a mere 1500 bpd.
Australia is a key supplier of fuel to some of the
smaller markets in the Pacific, including the Solomon
Islands, New Caledonia, Papua New Guinea, Vanuatu, Fiji,
French Polynesia, and Samoa. Although the amounts are
small, in many cases Australia is the sole source of supply
for these islands, and the export avenues therefore have a
greater significance than the volumes suggest.
Conclusion: can Australia reduce its
carbon intensity as pledged?
There is no doubt that fossil energy resources have
contributed enormously to the Australian economy.
Figure 6.
Australia’s refined product imports are growing,
exports stagnating (‘000 bpd). Source: Department of
Environment and Energy.
Figure 5.
Australia’s refinery capacity (‘000 bpd). Source: BP.