


 16 / 100

August
2019
HYDROCARBON
ENGINEERING
14
BP’s Chief Economist, Spencer Dale, observed that some of
the world’s increase in energy demand stemmed from
severe weather – a symptom of global climate change. Thus,
the cycle worsened in 2018. Dale concluded “Last year’s
developments sound yet another warning alarm that the
world is on an unsustainable path.”
1
Australia is in the midst of battling global climate
change, and the country has relatively more to lose if the
battle is lost. The actions taken on this issue will affect the
Australian energy industry more than any other single
factor. This article will discuss Australia’s love-hate
relationship with fossil energy, the challenge of global
climate change, the growth of the LNG industry, the
shrinking of the downstream oil industry, and the impact
this has had on refined product trade.
Fossil dependence and the short-lived
carbon tax
Australia possesses significant reserves of oil, natural gas, and
coal. Developing, using, and trading these fuels contributed
enormously to Australia’s overall economic development and
prosperity in past decades. They also provide for the great
majority of Australia’s energy needs today. Fossil energy
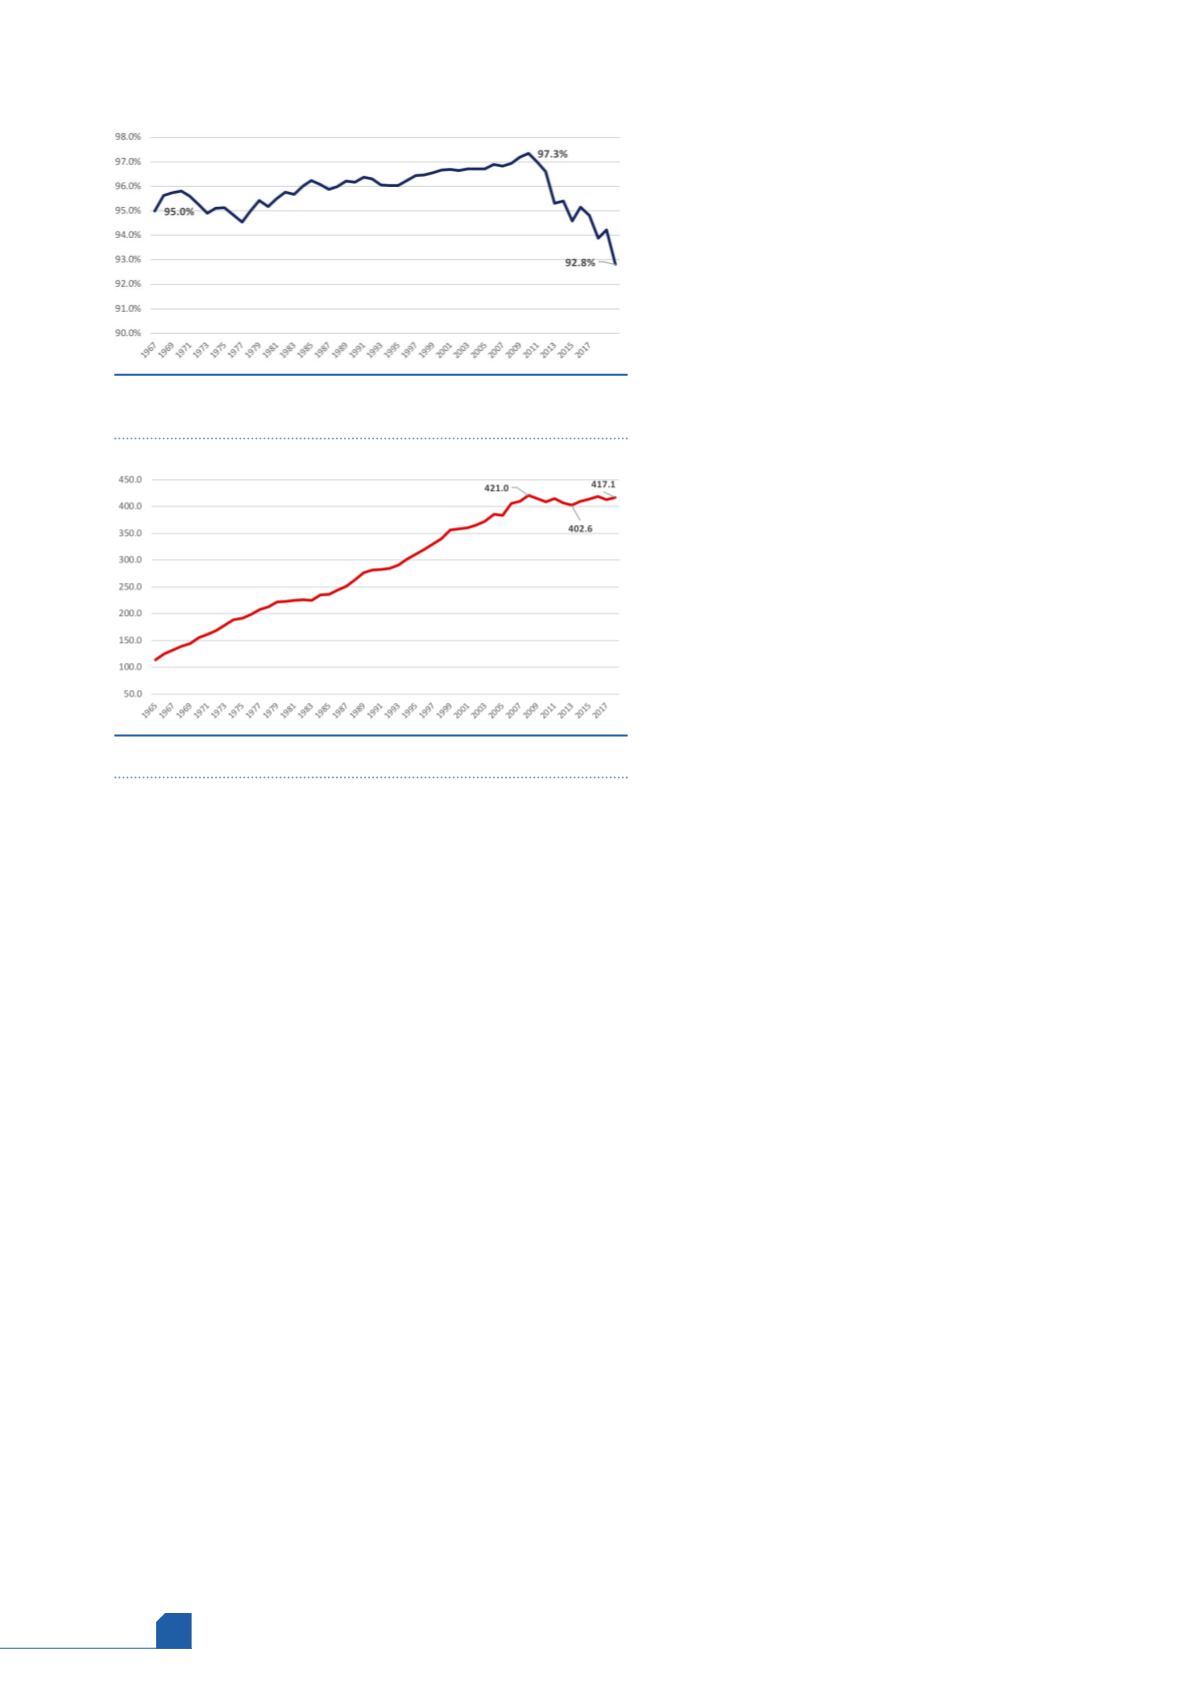
accounts for 92.8% of Australian primary energy. Clearly,
whittling away at this fuel mix is an immense undertaking. Yet
Australia must take steps to reduce its emissions. The
government remains determined to meet its Paris Agreement
target of a 28% reduction in emissions between the 2005
baseline and 2030. But recent developments have placed
Australia even further away from meeting this pledge.
It was clear more than a decade ago that coal and fossil
energy use would have to be cut, and that a carbon tax
would be the logical way to achieve this. The
government, led by the Labor Party, instituted a carbon
tax in July 2012. However, there was not enough
bipartisan support for the tax. The opposition
Liberal-National coalition quickly launched a campaign
with a catchy ‘axe the tax’ slogan, won control of the
government, and repealed the tax in July 2014. Australian
coal consumption, which had been declining for five
years, ratcheted back up in 2015 and 2016. CO
2
emission
also rose in 2014, 2015, and 2016.
Australia has made some progress on its overwhelming
dependence on fossil energy. As Figure 1 illustrates, fossil
energy dependence was 95% in 1965, and it gently trended
up to a peak of over 97% in the 2007 – 2009 period. Coal
use hit an all-time high in 2008, which was the year that
oil prices spiked, making domestic coal even more
economically attractive. Oil prices collapsed in 2009, and
oil demand began to rise. During the decade from
2008 – 2018, BP reports that Australian oil demand rose at
1.7% per year, natural gas use rose at 3.8% per year, and
alternatives and renewables use grew at 11.5% per year.
Coal use shrank at a rate of 2.7% per year.
Coal’s downward path has been bumpy, however. Coal
demand fell in the years leading to the carbon tax, then
edged back up when the tax was repealed. According to
the Department of Environment and Energy, coal use in
the electric power sector fell for five years in a row from
2008 – 2009 to 2013 – 2014 before rising again in
2014 – 2015 and 2015 – 2016. Despite this small recovery, coal’s
share of electric power generation shrank at a rate of 1.5% per
year on average during the decade from 2007 – 2008 to
2017 – 2018. The share of renewables expanded at a rate of
8.3% during that time, led by hydro, wind, and solar power.
Unsurprisingly, Australia’s CO
2
emissions also rose as fossil
energy use increased. The 2008 peak in coal use
corresponded with a peak of 421 million t of CO
2
emissions,
as shown in Figure 2. Government actions including the
carbon tax helped flatten the upward trend in carbon
emissions. CO
2
emissions fell to 402.6 million t in 2013. The
carbon tax was repealed in 2014, and CO
2
emissions crept
back up to 417.1 million t in 2018.
The debate continues over how much should be spent,
and by whom, to protect the environment. The carbon
intensity of coal, for example, is approximately twice that of
natural gas, but Australia has a massive coal industry.
Australia is the world’s largest exporter of coal, with exports
in 2018 valued at US$47 billion. Many coal deposits are
located close to consumers, and favourable transport
economics channel coal into the domestic market. Coal is
considered a low-cost source of energy, and it accounted for
30.8% of Australia’s energy mix in 2018. This level has been
cut significantly, from 44.3% a decade earlier in 2008. Still, it
remains one of the highest percentages in OECD, exceeded
only by the Czech Republic and Poland, who joined the
OECD in the mid-1990s.
According to the Australian government, the country’s
resources and energy sector accounted for 8.8% of Australian
GDP in 2018.
2
These commodities include iron ore, LNG, coal
and metals. This economic sector represented 57% of goods
exports in 2018 and provided 250 000 jobs.
Figure 2.
Australia CO
2
emissions (million t). Source: BP.
Figure 1.
Australia primary energy consumption (% fossil).
Source: BP.