


 42 / 76

July
2020
HYDROCARBON
ENGINEERING
40
GC is a well-known technique where individual components in
the gas are physically separated via column based on size and
polarity. Concentrations of each component are calculated
independently. Each eluted component is then utilised to
calculate the total Btu in the instrument software via equation 1:
Btu
stream
=
∑
χ
i
⁕
H
I
(1)
Where:
Btu
stream
= the total heating value of the stream.
x
I
= the concentration of the gas for component i.
H
I
= the heating value for component i in Btu/ft
3
.
GC is recognised as the technique that is most effective at
separating individual components in gas mixtures. Additionally,
it carries a relatively low purchase cost, can analyse higher
hydrocarbons, and can analyse nitrogen (N
2
) and H
2
when
coupled with a thermal conductivity detector. GCs have high
operational cost as they require a constant stream of carrier gas
(often helium) and have limited versatility as hardware must
often be changed out in order to change the analytes/method.
Analysis times also take minutes, leaving little room for error
and potentially missing a rapid flaring event.
Mass spectrometry is a versatile, dynamic, and
cost-effective technique that provides quantitative, accurate,
multi-component analysis in a real-time manner. A mass
spectrometer, in general, is comprised of three regions – an ion
source, a mass filter, and a detector. Process gas is first ionised by
electrons generated from a filament. After initial ionisation, any
additional energy attributed to each component results in
fragmentation and/or formation of a doubly charged (+2) ion.
These ions can then undergo further secondary reactions with
additional process gas to formmore ions and fragments. The
swarm of resultant ions is focused through a series of lenses
towards the mass filter, which selects out a specific ion at a
particular mass-to-charge (
m/z
) ratio. Because this separation
occurs through electromagnetism, a single point is collected in
a matter of milliseconds and a scan, otherwise known as a cycle
through all of the
m/zs
, only takes a few seconds. The detector
amplifies the signal for each
m/z
, which together produces a
spectrum. Each component has a characteristic ionisation and
fragmentation pattern/spectrum for a given set of tuning
parameters serving as a ‘fingerprint’ for that substance. For a
mixture of components, each component can be separated and
quantified with an accuracy 0.2 – 1% of reading through
deconvolution software based on a knowledge of each
component’s spectrum, obtained through calibration. These
concentrations can further be converted to BTU readings via
equation 1. The technique works very well on a wide variety of
components from H
2
, O
2
, N
2
, CO, CO
2
, lower and higher
hydrocarbons, and many others, eliminating the need for
secondary detectors. Analytes can be added, or analytical
methods modified by simply making adjustments in the
software without the need for additional hardware.
Maintenance is also low as no carrier gas is required. Given
these advantages, a process mass spectrometer is an ideal
analyser for monitoring Btu content in flares.
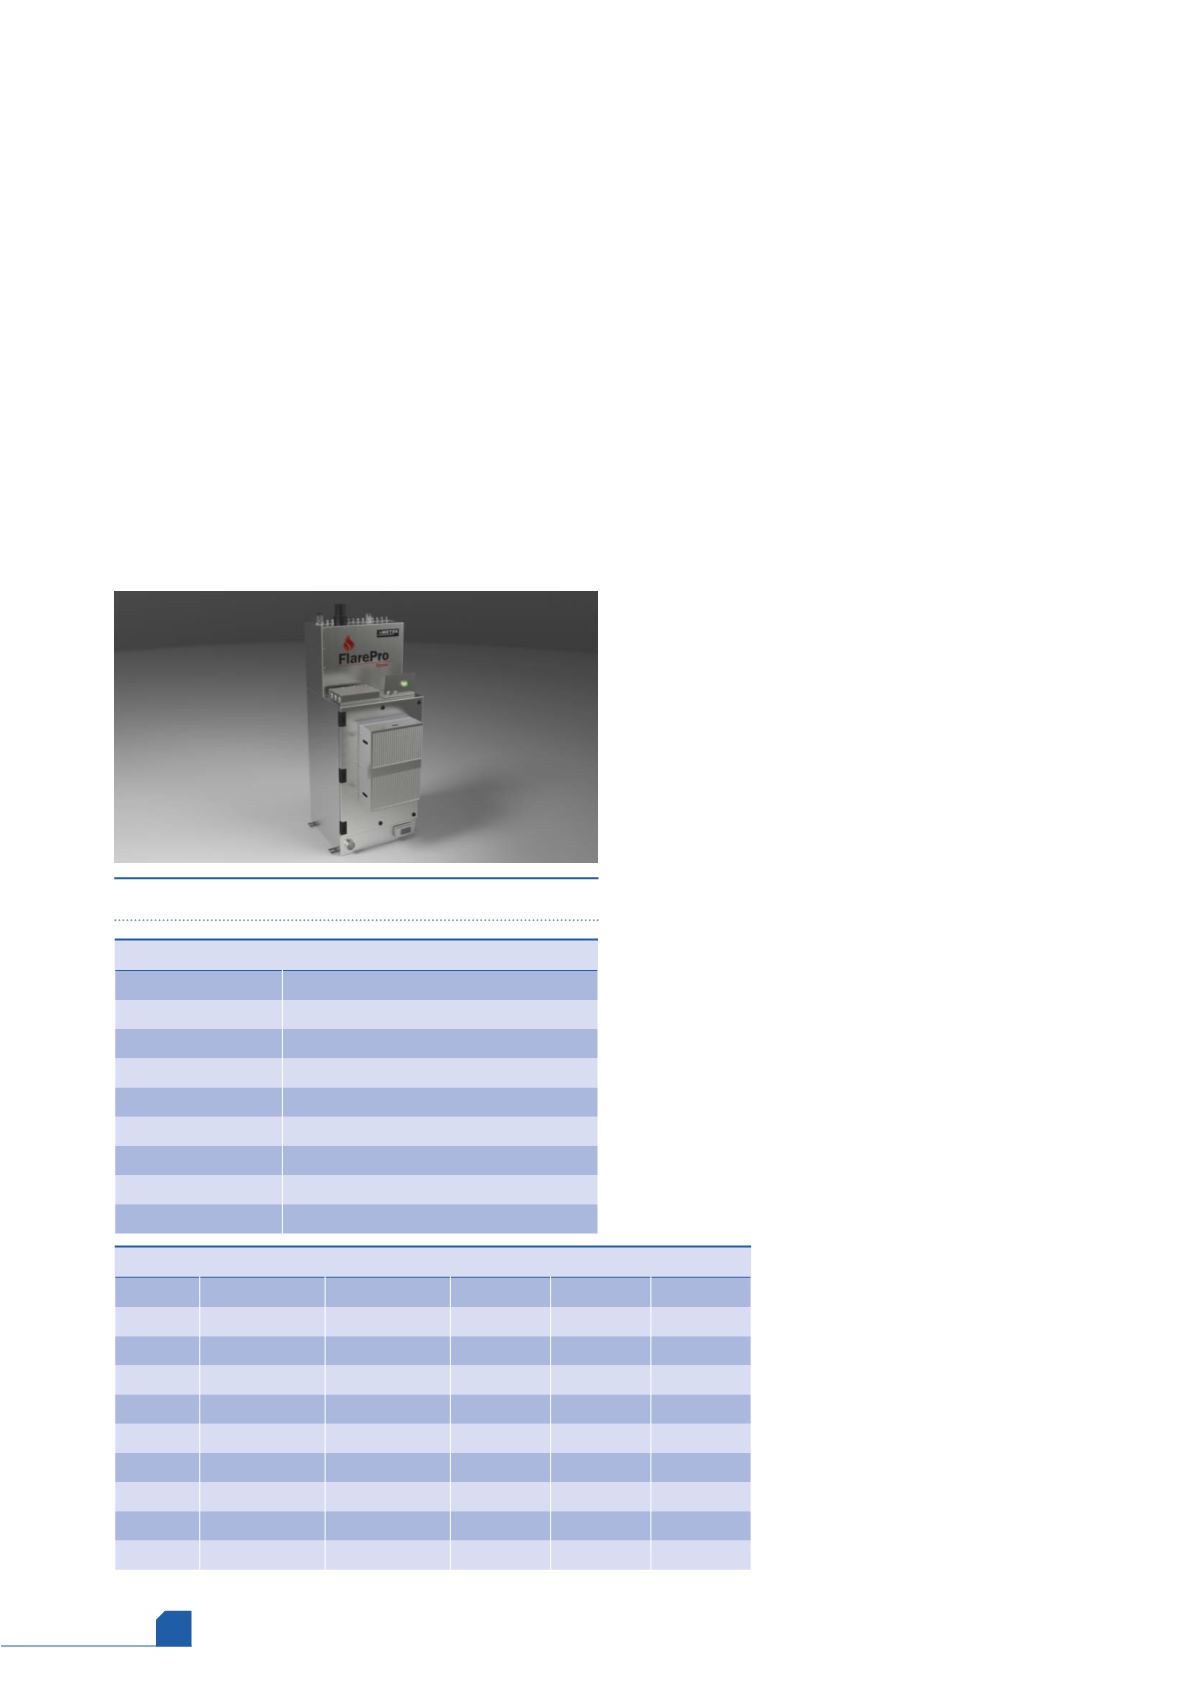
Experimental
All gases in this study were ultra high purity (UHP) grade and
analysed with AMETEK’s FlarePro process mass spectrometer
(Figure 1). In this instrument, designed for Class 1, Division 2,
Groups C and D, gases are introduced at 5 – 15 psi through a
heated sample boot, or one of 15 calibration ports, and into the
inlet box, which is kept at 150˚C and houses the sample
manifold as well as the pneumatic valves
that control the inlets.
From the manifold, the gas was leaked
through a 30
μ
m inside diameter (ID) silica
capillary into a chamber, which houses the
analyser head and is kept at < 10
-5
torr by a
turbomolecular pump, backed by a rotary
pump.
The gas was ionised by a tungsten
filament, filtered through a quadrupole
mass filter, and detected by a Faraday
plate. An electron multiplier is optional
but was not utilised for this study.
A quadrupole mass filter consists of
four parallel metal rods. Opposing rods
Table 2.
Validation gas cylinder composition and theoretical total HHV/LHV
LHV* (Btu/scf) HHV* (Btu/ft
3
) Low % Mid % High %
Hydrogen 273
1212
14.31
34.00
54.10
Methane 909
1010
81.64
56.91
32.49
Ethane 1619
1770
3.00
6.79
10.26
Propane 2315
2516
0.75
1.50
2.25
Butane 3101
3369
0.15
0.30
0.45
Pentane 3709
4009
0.15
0.30
0.45
Btu (LHV)
859
776
692
Btu (HHV)
1083
1169
1255
Table 1.
Binary gas mixtures utilised for calibration
Analyte
Binary gas
Methane
50:50 methane/argon
Ethane
10% ethane balance argon
Propane
5% propane balance helium
Butane
2% butane balance helium
Pentane
5000 ppm pentane balance helium
Carbon dioxide
5% carbon dioxide balance argon
Carbon monoxide
5% carbon monoxide balance argon
Nitrogen
5% nitrogen balance helium
Figure 1.
FlarePro mass spectrometer.