


 44 / 76

July
2020
HYDROCARBON
ENGINEERING
42
are electrically connected. One pair of rods has an applied
potential of –{U+Vcos(
ω
t)} while the other has a potential of
+{U+Vcos(
ω
t)}, where U is a fixed potential and Vcos(
ω
t) is a
sinusoidally alternating potential with amplitude V and
frequency
ω
. Entering ions have trajectories dependent on their
mass-to-charge ratio. Each combination of the fixed potential
and alternating potential results in ions of a specific
m/z
having a
stable trajectory to traverse through the quadrupole. The
remaining ions possess unstable trajectories, do not pass through
the quadrupole, and are not detected.
Data was processed, converted to concentrations and,
subsequently, Btu values through Process 2000 software. The raw
ion currents of the following masses were monitored for
quantitative purposes;
m/z
2,
m/z
12,
m/z
15,
m/z
28,
m/z
29,
m/z
30,
m/z
43,
m/z
44, and
m/z
72. Masses were chosen such
that each component measured had a unique set of
m/zs
to
discern them from each other to generate a calibration matrix.
m/z
40 and
m/z
4 were utilised to qualitatively monitor the
balance gases of argon and helium used in this study,
respectively. Additionally,
m/z
32, which corresponds to oxygen,
was qualitatively monitored to discern the presence of any leaks.
A maximum of 32 components can be analysed simultaneously
with the analyser.
Calibration was performed in three steps – background
calibration, binary calibration, and sensitivity calibration. Argon,
with no masses in the spectrum, was utilised to collect a
background. A series of binary cylinders (Table 1) were then
analysed to obtain the fragmentation patterns for each
component at the given tune.
The software uses these fragmentation patterns to
fingerprint each component and deconvolute the spectra.
Finally, a sensitivity calibration was performed using a certified
blend gas containing hydrogen, methane, ethane, propane,
butane and pentane, nitrogen, carbon monoxide, and carbon
dioxide in order to determine the instrument response factors
for each component.
A series of three certified validation gases with components
that span the typical concentrations (Table 2) was analysed to
test the accuracy of the mass spectrometer. Component
concentrations were converted to Btu utilising the LHV* and
HHV* constants in Table 2 as well as equation 1. These were then
compared to the theoretical values.
Results and discussion
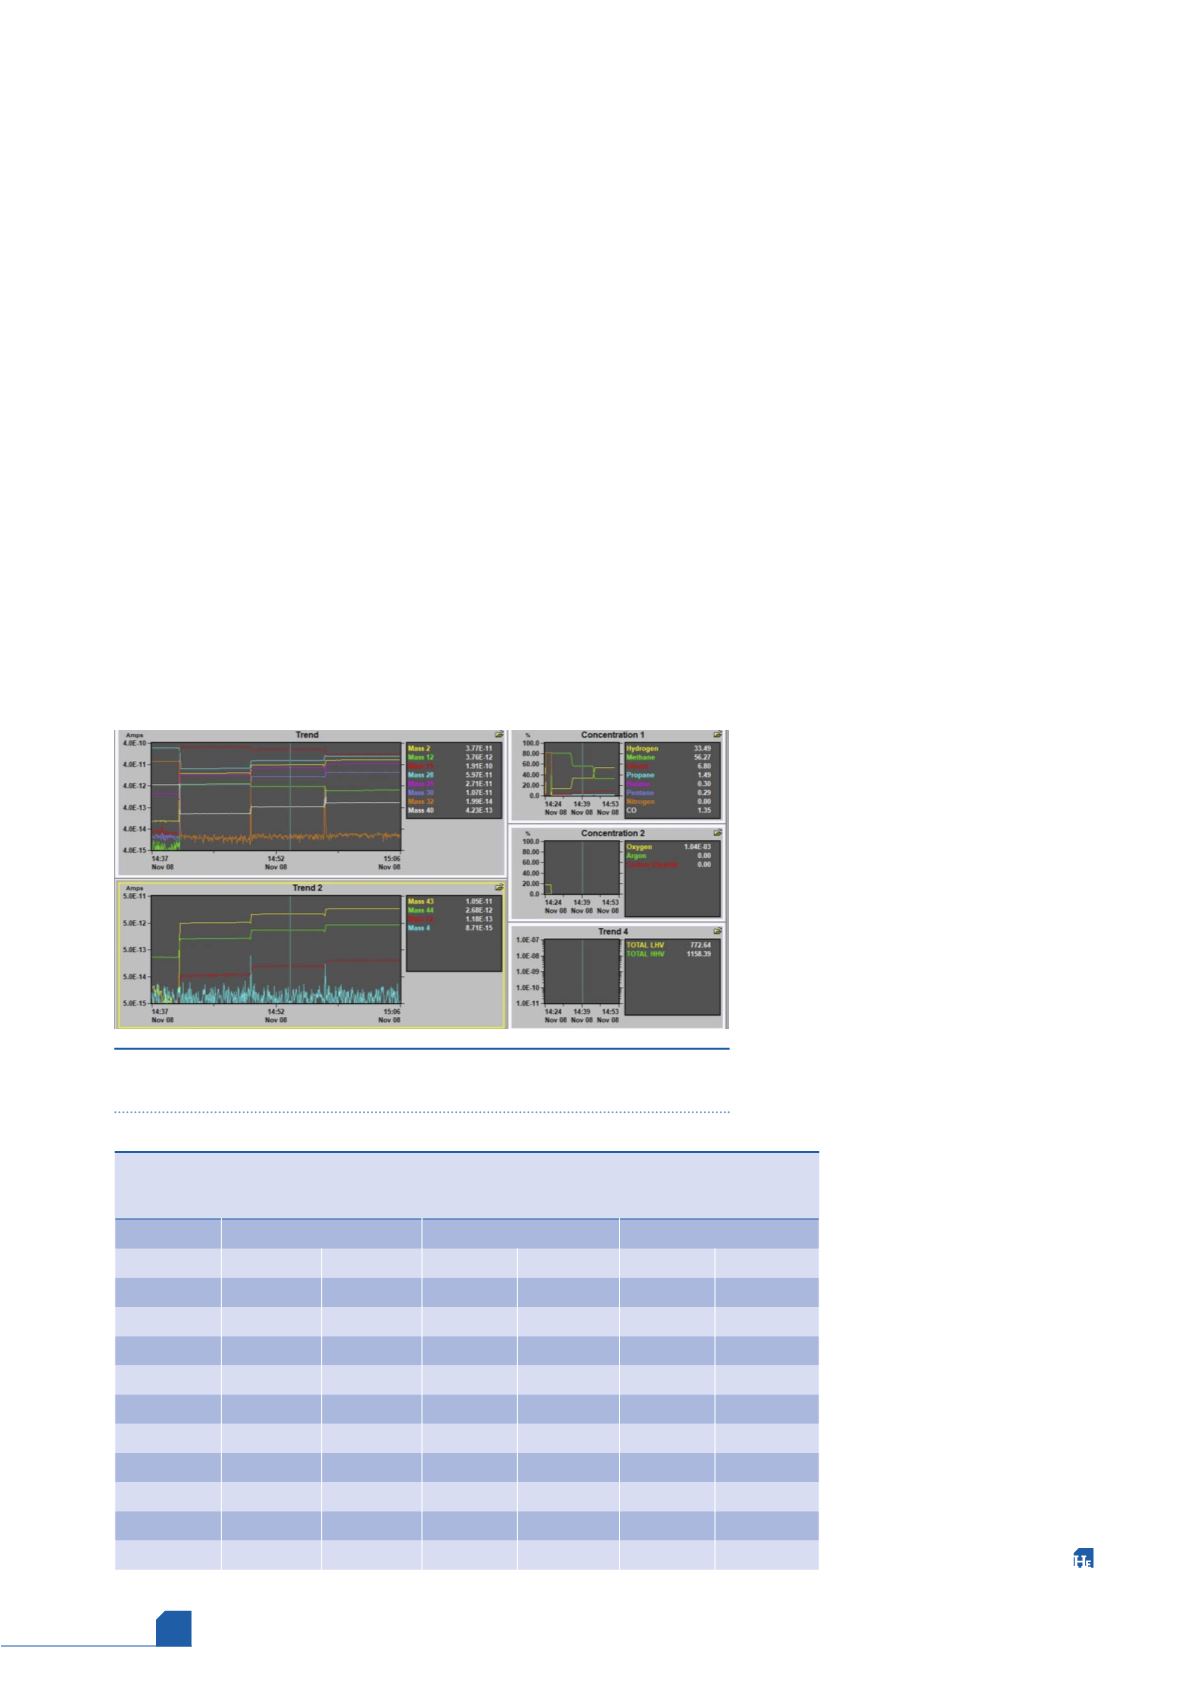
Data trends for the low, mid, and high percent concentrations
and Btu readings vs time were recorded and the mid percent
validation readings are shown in Figure 2. For each non-noise ion
monitored, readouts were very stable with a signal STD of < 0.5%
in each case.
Calculated concentrations vs true cylinder concentrations
and calculated Btu values from the mass
spectrometer are displayed in Table 3 for the
low, mid, and high percent gases, respectively.
All concentrations as well as total LHV and
HHV Btu values for the cylinders showed
excellent agreement with the true values. The
errors in the component concentrations across
the range of the three cylinders were
1.70
±
0.35%, 1.16
±
0.26%, 0.56
±
0.44%,
3.21
±
4.1%, 0.18
±
0.10%, and 3.98
±
2.33% for
hydrogen, methane, ethane, propane, butane,
and pentane, with most concentrations being
within 2% of the true value and all being well
within the 10% regulatory guideline. The
calculated Btu values in each case were within
1% of the true value.
This study suggests that mass spectrometry
is highly accurate in measuring Btu
values in flare gases. Additionally,
mass spectrometry provides a high
degree of speciation for individual
components both organic and
inorganic of interest common in
flare mixtures. The range of
analytes and accuracy displayed
with each eliminate the need for
secondary detectors. Combining
its versatility, configurability, and
adaptability to various
environments with fast response,
accuracy, and low total cost of
ownership, process mass
spectrometry proves to be an
excellent analytical tool for
component concentration and Btu
monitoring in the flare industry.
Table 3.
Mass spec concentration readings vs certified cylinder concentrations
and mass spec Btu calculations vs true Btu values for the low %, mid % and
high % validation cylinders
Low % validation
Mid % validation
High % validation
True (%)
Reading (%) True (%)
Reading (%) True (%)
Reading (%)
Hydrogen 14.31
14.11
34.20
33.49
54.10
53.22
Methane
81.64
80.47
56.91
56.27
32.49
32.19
Ethane
3.00
3.03
6.79
6.80
10.26
10.20
Propane
0.75
0.81
1.50
1.49
2.25
2.23
Butane
0.15
0.15
0.30
0.30
0.45
0.45
Pentane
0.15
0.14
0.30
0.29
0.45
0.44
LHV
HHV
LHV
HHV
LHV
HHV
True (Btu)
859
1083
776
1169
692
1255
Reading (Btu) 852
1072
772
1158
690
1244
% deviation 1.0%
0.8%
0.5%
0.9%
0.3%
09%
Figure 2.
Stepwise analysis of the validation cylinders with component
concentration, LHV, and HHV readouts of the mid% validation cylinder.