


 82 / 100

August
2019
HYDROCARBON
ENGINEERING
80
conditions, i.e. actual pressure, temperature and gas
mix composition.
In order to accomplish this specific task, CMap
software uses an adequate computational model
that embeds and couples both compressor
aeromechanics and compressed gas thermodynamic
models.
In general, it may happen that during operational
time, the field inlet conditions are different from
specification conditions (usually indicated in the
machine data sheets). In these situations, an
adjustment of the design performance maps to
actual operative conditions is necessary to produce
an accurate quantitative assessment of compressor
performance.
The main purpose of this article is to provide a
method description and present numerical analysis
results showing the effect on compressor
performance caused by variations in individual gas
mixture components. Therefore, this article aims to
demonstrate that variations in performance maps
caused by changes in the gas mix composition can
be calculated using the capabilities provided by
CMap for compressor performance prediction.
All numerical evaluations executed with this
software reported in this article have been
developed using the most recent thermodynamic
theories and machine aero-mechanical models.
Also, they have been established according to
ASME PTC10 (Performance Test Code on
Compressors and Exhausters) standard.
The following section will describe the adopted
method and discuss the results obtained.
The starting point of the method is the
availability of a reference centrifugal compressor
performance map. This reference map may be OEM
datasheets or even ‘as tested’ maps. In general, any
congruent set of performance maps may be used as
a starting point for the method, provided that they
give a valid description of the compressor behaviour
in a known reference condition.
Starting from the reference gas mix composition
and thermodynamic conditions (pressure and
temperature), as well as the availability of reference
performance maps, the IPC software performs
complex calculations in a fully automated way and
generates the predicted compressor performance
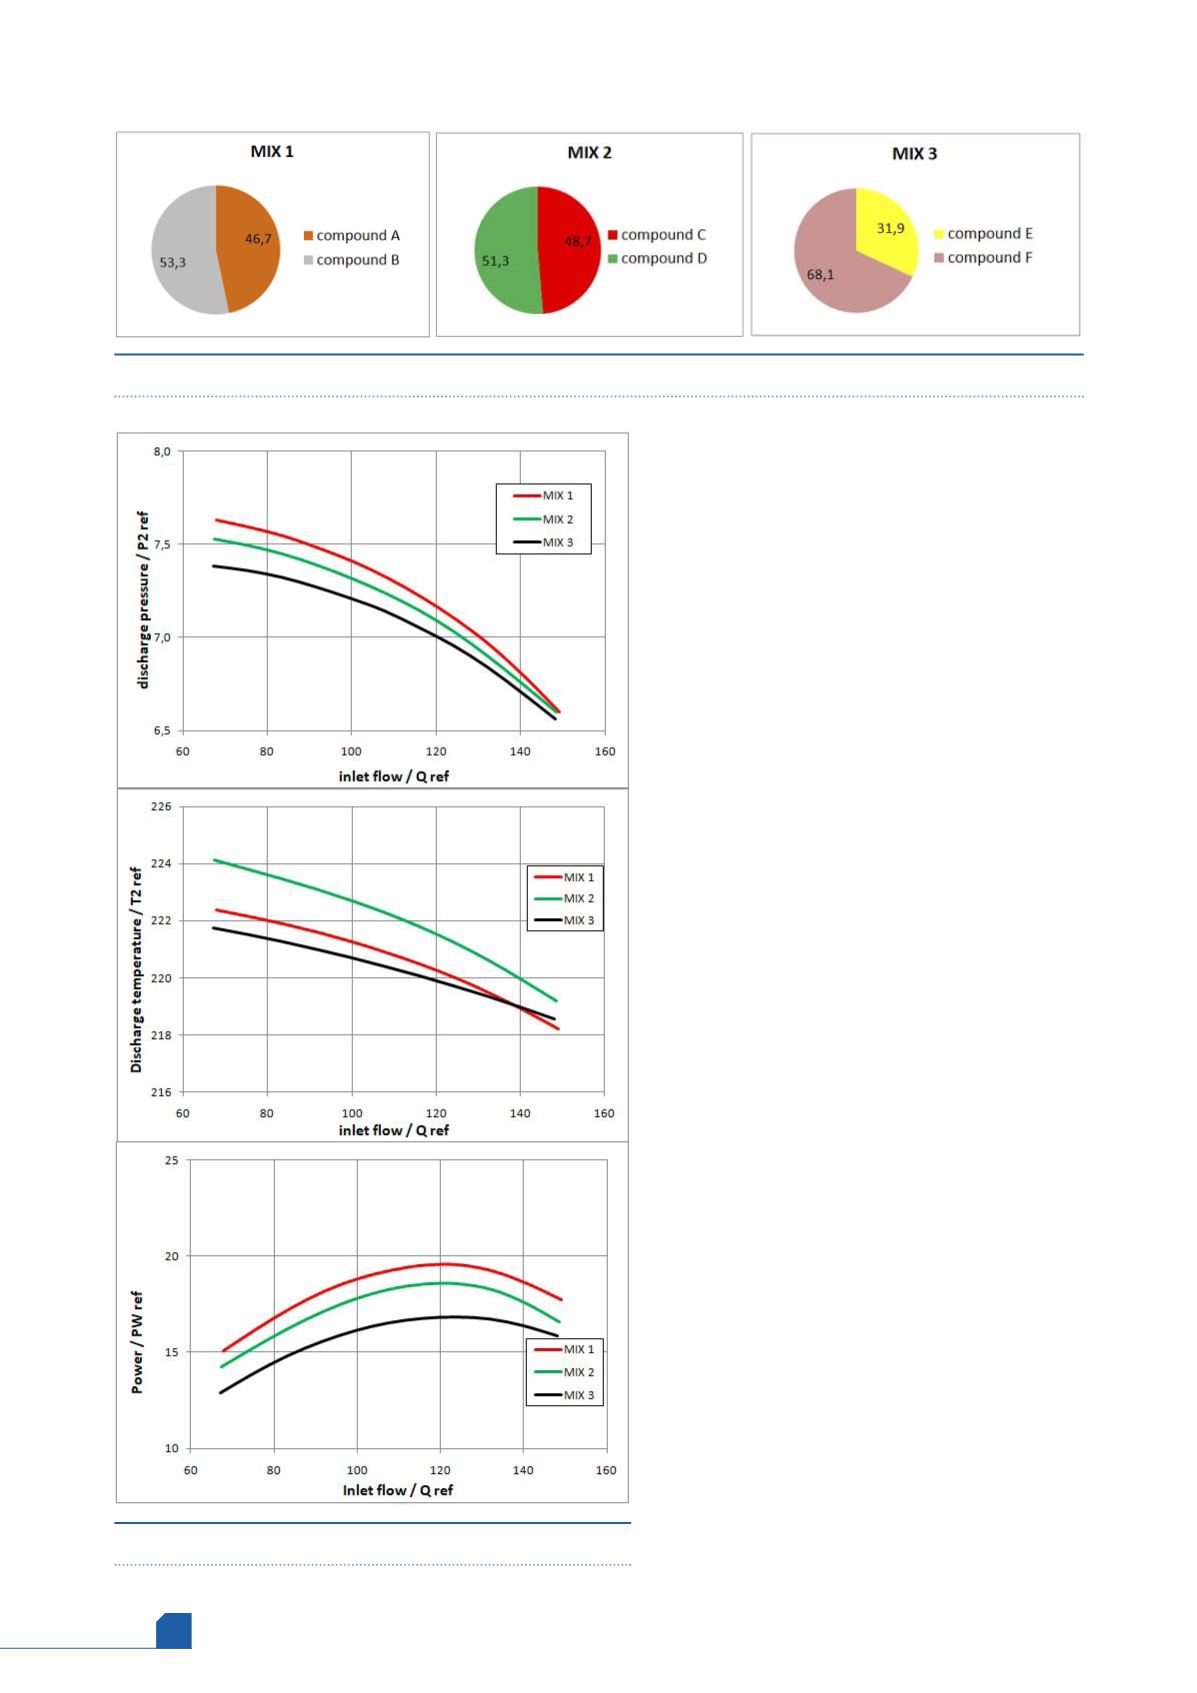
Figure 2.
Performance map of gas mixtures.
Figure 1.
Three different variations of the gas mixture being considered.